Making Pickle Files for Environmental Drivers of Spring Bloom Timing Analysis
(201905 only)
To use this notebook, change values in the second code cell and rerun the entire notebook for each year.
[1]:
import numpy as np
import matplotlib.pyplot as plt
import matplotlib.dates as mdates
import matplotlib as mpl
import netCDF4 as nc
import datetime as dt
from salishsea_tools import evaltools as et, places, viz_tools, visualisations, bloomdrivers
import xarray as xr
import pandas as pd
import pickle
import os

%matplotlib inline
To recreate this notebook at a different location
only change the following cell:
[2]:
# Change this to the directory you want the pickle files to be stored:
savedir='/ocean/aisabell/MEOPAR/extracted_files'
# Change 'S3' to the location of interest
loc='S3'
# To create the time series for a range of years, change iyear to every year within the range
#    and run all cells each time.
iyear=2020

# Leap years in 'dateslist':
if iyear==2000 or iyear==2004 or iyear==2008 or iyear==2012 or iyear==2016 or iyear==2020:  # leap years: 2020,2016,2012,2008 etc
    dateslist=[[dt.datetime(iyear,1,1),dt.datetime(iyear,1,31)],
               [dt.datetime(iyear,1,31),dt.datetime(iyear,2,29)],
               [dt.datetime(iyear,2,29),dt.datetime(iyear,4,1)]]
else:
    dateslist=[[dt.datetime(iyear,1,1),dt.datetime(iyear,1,31)],
               [dt.datetime(iyear,1,31),dt.datetime(iyear,2,28)],
               [dt.datetime(iyear,2,28),dt.datetime(iyear,4,1)]]

# What is the start year and end year+1 of the time range of interest?
startyear=2007
endyear=2021 # does NOT include this value

# Note: non-location specific variables only need to be done for each year, not for each location
# Note: x and y limits on the location map may need to be changed
[3]:
startjan=dt.datetime(iyear,1,1)  # january start date
endmar=dt.datetime(iyear,4,1)   # march end date (does not include this day)
fraserend=dt.datetime(iyear,3,31) # march end date specifically for Fraser River calculations (includes this day)
forbloomstart=dt.datetime(iyear,2,15) # long time frame to capture spring bloom date
forbloomend=dt.datetime(iyear,6,15)

year=str(iyear)
modver='201905'

fname=f'JanToMarch_TimeSeries_{year}_{loc}_{modver}.pkl' # for location specific variables
fname2=f'JanToMarch_TimeSeries_{year}_{modver}.pkl' # for non-location specific variables
fname3=f'springBloomTime_{year}_{loc}_{modver}.pkl' # for spring bloom timing calculation
fname4=f'JanToMarch_Mixing_{year}_{loc}_{modver}.pkl' # for location specific mixing variables
savepath=os.path.join(savedir,fname)
savepath2=os.path.join(savedir,fname2)
savepath3=os.path.join(savedir,fname3)
savepath4=os.path.join(savedir,fname4)
recalc=False
[4]:
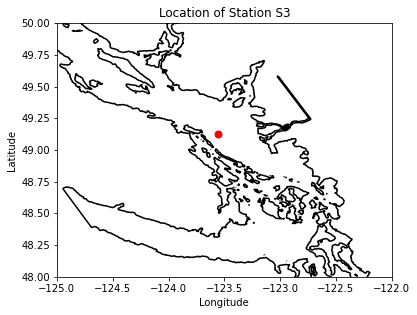
# lat and lon information for place:
lon,lat=places.PLACES[loc]['lon lat']
# get place information on SalishSeaCast grid:
ij,ii=places.PLACES[loc]['NEMO grid ji']
jw,iw=places.PLACES[loc]['GEM2.5 grid ji']

fig, ax = plt.subplots(1,1,figsize = (6,6))
with xr.open_dataset('/data/vdo/MEOPAR/NEMO-forcing/grid/mesh_mask201702.nc') as mesh:
    ax.contour(mesh.nav_lon,mesh.nav_lat,mesh.tmask.isel(t=0,z=0),[0.1,],colors='k')
    tmask=np.array(mesh.tmask)
    gdept_1d=np.array(mesh.gdept_1d)
    e3t_0=np.array(mesh.e3t_0)
ax.plot(lon, lat, '.', markersize=14, color='red')
ax.set_ylim(48,50)
ax.set_xlim(-125,-122)
ax.set_title('Location of Station %s'%loc)
ax.set_xlabel('Longitude')
ax.set_ylabel('Latitude')
viz_tools.set_aspect(ax,coords='map')
[4]:
1.1363636363636362
Creating pickles files for location specific variables
[5]:
if recalc==True or not os.path.isfile(savepath):
    basedir='/results2/SalishSea/nowcast-green.201905/'
    nam_fmt='nowcast'
    flen=1 # files contain 1 day of data each
    ftype= 'ptrc_T' # loads bio files
    tres=24 # 1: hourly resolution; 24: daily resolution
    bio_time=list()
    diat_alld=list()
    no3_alld=list()
    flag_alld=list()
    cili_alld=list()
    microzoo_alld=list()
    mesozoo_alld=list()
    intdiat=list()
    intphyto=list()
    spar=list()
    intmesoz=list()
    intmicroz=list()
    grid_time=list()
    temp=list()
    salinity=list()
    u_wind=list()
    v_wind=list()
    twind=list()
    solar=list()
    ik=0
    for ind, datepair in enumerate(dateslist):
        start=datepair[0]
        end=datepair[1]
        flist=et.index_model_files(start,end,basedir,nam_fmt,flen,ftype,tres)
        flist3 = et.index_model_files(start,end,basedir,nam_fmt,flen,"grid_T",tres)
        fliste3t = et.index_model_files(start,end,basedir,nam_fmt,flen,"carp_T",tres)
        with xr.open_mfdataset(flist['paths']) as bio:
            bio_time.append(np.array([pd.to_datetime(ii)+dt.timedelta(minutes=30) for ii in bio.time_counter.values]))
            no3_alld.append(np.array(bio.nitrate.isel(y=ij,x=ii)))  # 'all_d' = all depths
            diat_alld.append(np.array(bio.diatoms.isel(y=ij,x=ii)))
            flag_alld.append(np.array(bio.flagellates.isel(y=ij,x=ii)))
            cili_alld.append(np.array(bio.ciliates.isel(y=ij,x=ii)))
            microzoo_alld.append(np.array(bio.microzooplankton.isel(y=ij,x=ii)))
            mesozoo_alld.append(np.array(bio.mesozooplankton.isel(y=ij,x=ii)))

            with xr.open_mfdataset(fliste3t['paths']) as carp:
                intdiat.append(np.array(np.sum(bio.diatoms.isel(y=ij,x=ii)*carp.e3t.isel(y=ij,x=ii),1))) # 'int' = depth integrated
                intphyto.append(np.array(np.sum((bio.diatoms.isel(y=ij,x=ii)+bio.flagellates.isel(y=ij,x=ii)\
                                +bio.ciliates.isel(y=ij,x=ii))*carp.e3t.isel(y=ij,x=ii),1)))
                spar.append(np.array(carp.PAR.isel(deptht=ik,y=ij,x=ii))) # surface PAR
                intmesoz.append(np.array(np.sum(bio.mesozooplankton.isel(y=ij,x=ii)*carp.e3t.isel(y=ij,x=ii),1)))
                intmicroz.append(np.array(np.sum(bio.microzooplankton.isel(y=ij,x=ii)*carp.e3t.isel(y=ij,x=ii),1)))

        with xr.open_mfdataset(flist3['paths']) as grid:
            grid_time.append(np.array([pd.to_datetime(ii)+dt.timedelta(minutes=30) for ii in grid.time_counter.values]))
            temp.append(np.array(grid.votemper.isel(deptht=ik,y=ij,x=ii)) )#surface temperature
            salinity.append(np.array(grid.vosaline.isel(deptht=ik,y=ij,x=ii))) #surface salinity

        jW,iW,wopsdir,wnam_fmt=bloomdrivers.getWindVarsYear(iyear,loc)
        if start==dt.datetime(2007,1,1):
            start=dt.datetime(2007,1,3)
        else:
            pass

        flist2=et.index_model_files(start,end,wopsdir,wnam_fmt,flen=1,ftype='None',tres=24)
        with xr.open_mfdataset(flist2['paths']) as winds:
            u_wind.append(np.array(winds.u_wind.isel(y=jW,x=iW)))
            v_wind.append(np.array(winds.v_wind.isel(y=jW,x=iW)))
            twind.append(np.array(winds.time_counter))
            solar.append(np.array(winds.solar.isel(y=jW,x=iW)))

    bio_time=np.concatenate(bio_time,axis=0)
    diat_alld=np.concatenate(diat_alld,axis=0)
    no3_alld=np.concatenate(no3_alld,axis=0)
    flag_alld=np.concatenate(flag_alld,axis=0)
    cili_alld=np.concatenate(cili_alld,axis=0)
    microzoo_alld=np.concatenate(microzoo_alld,axis=0)
    mesozoo_alld=np.concatenate(mesozoo_alld,axis=0)
    intdiat=np.concatenate(intdiat,axis=0)
    intphyto=np.concatenate(intphyto,axis=0)
    spar=np.concatenate(spar,axis=0)
    intmesoz=np.concatenate(intmesoz,axis=0)
    intmicroz=np.concatenate(intmicroz,axis=0)
    grid_time=np.concatenate(grid_time,axis=0)
    temp=np.concatenate(temp,axis=0)
    salinity=np.concatenate(salinity,axis=0)
    u_wind=np.concatenate(u_wind,axis=0)
    v_wind=np.concatenate(v_wind,axis=0)
    twind=np.concatenate(twind,axis=0)
    solar=np.concatenate(solar,axis=0)

    # Calculations based on saved values:
    no3_30to90m=np.sum(no3_alld[:,22:26]*e3t_0[:,22:26,ij,ii],1)/np.sum(e3t_0[:,22:26,ij,ii]) # average, considering cell thickness
    sno3=no3_alld[:,0] # surface nitrate
    sdiat=diat_alld[:,0] # surface diatoms
    sflag=flag_alld[:,0] # surface flagellates
    scili=cili_alld[:,0] # surface ciliates
    intzoop=intmesoz+intmicroz # depth-integrated zooplankton
    fracdiat=intdiat/intphyto # fraction of depth-integrated phytoplankton that is diatoms
    zoop_alld=microzoo_alld+mesozoo_alld # zooplankton at all depths
    sphyto=sdiat+sflag+scili # surface phytoplankton
    phyto_alld=diat_alld+flag_alld+cili_alld # phytoplankton at all depths
    percdiat=sdiat/sphyto # fraction of surface phytoplankton that is diatoms

    # wind speed:
    wspeed=np.sqrt(u_wind**2 + v_wind**2)
    # wind direction in degrees from east:
    d = np.arctan2(v_wind, u_wind)
    winddirec=np.rad2deg(d + (d < 0)*2*np.pi)

    allvars=(bio_time,diat_alld,no3_alld,flag_alld,cili_alld,microzoo_alld,mesozoo_alld,
              intdiat,intphyto,spar,intmesoz,intmicroz,
            grid_time,temp,salinity,u_wind,v_wind,twind,solar,
            no3_30to90m,sno3,sdiat,sflag,scili,intzoop,fracdiat,zoop_alld,sphyto,phyto_alld,percdiat,
            wspeed,winddirec)
    pickle.dump(allvars,open(savepath,'wb'))
else:
    pvars=pickle.load(open(savepath,'rb'))
    (bio_time,diat_alld,no3_alld,flag_alld,cili_alld,microzoo_alld,mesozoo_alld,
              intdiat,intphyto,spar,intmesoz,intmicroz,
            grid_time,temp,salinity,u_wind,v_wind,twind,solar,
            no3_30to90m,sno3,sdiat,sflag,scili,intzoop,fracdiat,zoop_alld,sphyto,phyto_alld,percdiat,
            wspeed,winddirec)=pvars
Creating pickles files for location specific mixing variables
[6]:
fname4=f'JanToMarch_Mixing_{year}_{loc}_{modver}.pkl' # for location specific mixing variables
savepath4=os.path.join(savedir,fname4)
if recalc==True or not os.path.isfile(savepath4):
    basedir='/results2/SalishSea/nowcast-green.201905/'
    nam_fmt='nowcast'
    flen=1 # files contain 1 day of data each
    tres=24 # 1: hourly resolution; 24: daily resolution
    halocline=list() # daily average depth of halocline
    eddy=list() # daily average eddy diffusivity
    flist=et.index_model_files(startjan,endmar,basedir,nam_fmt,flen,"grid_T",tres)
    flist2=et.index_model_files(startjan,endmar,basedir,nam_fmt,flen,"grid_W",1)

    for filedate in flist['paths']:
        halocline.append(bloomdrivers.halo_de(filedate,ii,ij))

    for day in flist2['paths']:  # this goes through each day and takes the daily average
        with xr.open_dataset(day) as gridw:
            eddy.append(np.mean(np.array(gridw.vert_eddy_diff.isel(y=ij,x=ii)),axis=0))
            depth=np.array(gridw.depthw)

    with xr.open_mfdataset(flist['paths']) as gridt:
        grid_time=np.array([pd.to_datetime(ii)+dt.timedelta(minutes=30) for ii in gridt.time_counter.values])
        temp=np.array(gridt.votemper.isel(y=ij,x=ii)) # all depths temperature
        salinity=np.array(gridt.vosaline.isel(y=ij,x=ii)) # all depths salinity

    allvars=(halocline,eddy,depth,grid_time,temp,salinity)
    pickle.dump(allvars,open(savepath4,'wb'))
else:
    pvars=pickle.load(open(savepath4,'rb'))
    (halocline,eddy,depth,grid_time,temp,salinity)=pvars
Creating pickles files for bloom timing calculations
[7]:
if recalc==True or not os.path.isfile(savepath3):
    basedir='/results2/SalishSea/nowcast-green.201905/'
    nam_fmt='nowcast'
    flen=1 # files contain 1 day of data each
    ftype= 'ptrc_T' # load bio files
    tres=24 # 1: hourly resolution; 24: daily resolution
    flist=et.index_model_files(forbloomstart,forbloomend,basedir,nam_fmt,flen,ftype,tres)
    flist2=et.index_model_files(forbloomstart,forbloomend,basedir,nam_fmt,flen,"carp_T",tres)

    ik=0
    with xr.open_mfdataset(flist['paths']) as bio:
        bio_time0=np.array([pd.to_datetime(ii)+dt.timedelta(minutes=30) for ii in bio.time_counter.values])
        sno30=np.array(bio.nitrate.isel(deptht=ik,y=ij,x=ii))
        sdiat0=np.array(bio.diatoms.isel(deptht=ik,y=ij,x=ii))
        sflag0=np.array(bio.flagellates.isel(deptht=ik,y=ij,x=ii))
        scili0=np.array(bio.ciliates.isel(deptht=ik,y=ij,x=ii))
        no3_alld0=np.array(bio.nitrate.isel(y=ij,x=ii))
        diat_alld0=np.array(bio.diatoms.isel(y=ij,x=ii))
        flag_alld0=np.array(bio.flagellates.isel(y=ij,x=ii))
        cili_alld0=np.array(bio.ciliates.isel(y=ij,x=ii))
        with xr.open_mfdataset(flist2['paths']) as carp:
            intdiat0=np.array(np.sum(bio.diatoms.isel(y=ij,x=ii)*carp.e3t.isel(y=ij,x=ii),1)) # depth integrated diatom
            intphyto0=np.array(np.sum((bio.diatoms.isel(y=ij,x=ii)+bio.flagellates.isel(y=ij,x=ii)\
                            +bio.ciliates.isel(y=ij,x=ii))*carp.e3t.isel(y=ij,x=ii),1))
    fracdiat0=intdiat0/intphyto0 # depth integrated fraction of diatoms

    sphyto0=sdiat0+sflag0+scili0
    phyto_alld0=diat_alld0+flag_alld0+cili_alld0
    percdiat0=sdiat0/sphyto0 # percent diatoms

    pickle.dump((bio_time0,sno30,sdiat0,sflag0,scili0,diat_alld0,no3_alld0,flag_alld0,cili_alld0,phyto_alld0,\
                 intdiat0,intphyto0,fracdiat0,sphyto0,percdiat0),open(savepath3,'wb'))
else:
    bio_time0,sno30,sdiat0,sflag0,scili0,diat_alld0,no3_alld0,flag_alld0,cili_alld0,phyto_alld0,\
                 intdiat0,intphyto0,fracdiat0,sphyto0,percdiat0=pickle.load(open(savepath3,'rb'))
Creating pickles files for non-location specific variables:
[8]:
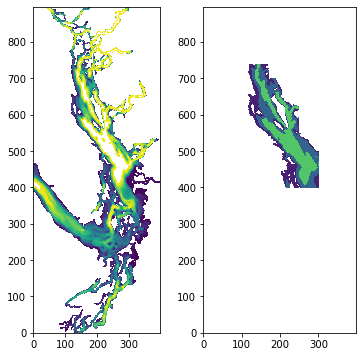
# define sog region:
fig, ax = plt.subplots(1,2,figsize = (6,6))
with xr.open_dataset('/data/vdo/MEOPAR/NEMO-forcing/grid/bathymetry_201702.nc') as bathy:
    bath=np.array(bathy.Bathymetry)
ax[0].contourf(bath,np.arange(0,250,10))
viz_tools.set_aspect(ax[0],coords='grid')
sogmask=np.copy(tmask[:,:,:,:])
sogmask[:,:,740:,:]=0
sogmask[:,:,700:,170:]=0
sogmask[:,:,550:,250:]=0
sogmask[:,:,:,302:]=0
sogmask[:,:,:400,:]=0
sogmask[:,:,:,:100]=0
#sogmask250[bath<250]=0
ax[1].contourf(np.ma.masked_where(sogmask[0,0,:,:]==0,bathy.Bathymetry),[0,100,250,550])
[8]:
<matplotlib.contour.QuadContourSet at 0x7f2f90145160>
[9]:
k250=32 # approximate index for 250 m
if recalc==True or not os.path.isfile(savepath2):

    basedir='/results2/SalishSea/nowcast-green.201905/'
    nam_fmt='nowcast'
    flen=1 # files contain 1 day of data each
    ftype= 'ptrc_T' # load bio files
    tres=24 # 1: hourly resolution; 24: daily resolution
    flist=et.index_model_files(startjan,endmar,basedir,nam_fmt,flen,ftype,tres)
    flist3 = et.index_model_files(startjan,endmar,basedir,nam_fmt,flen,"grid_T",tres)
    fliste3t = et.index_model_files(startjan,endmar,basedir,nam_fmt,flen,"carp_T",tres)

    ik=0
    with xr.open_mfdataset(flist['paths']) as bio:
        no3_past250m=np.array(np.sum(np.sum(np.sum(bio.nitrate.isel(deptht=slice(32,40))*sogmask[:,32:,:,:]*e3t_0[:,32:,:,:],3),2),1)\
                /np.sum(sogmask[0,32:,:,:]*e3t_0[0,32:,:,:]))

    if iyear !=2020:
        # reading Fraser river flow files
        dfFra=pd.read_csv('/ocean/eolson/MEOPAR/obs/ECRivers/Flow/FraserHopeDaily__Feb-8-2021_06_29_29AM.csv',
                          skiprows=1)
        # the original file contains both flow and water level information in the same field (Value)
        # keep only the flow data, where PARAM=1 (drop PARAM=2 values, water level data)
        # flow units are m3/s
        # DD is YD, year day (ie. 1 is jan 1)
        dfFra.drop(dfFra.loc[dfFra.PARAM==2].index,inplace=True)

        # rename 'Value' column to 'Flow' now that we have removed all the water level rows
        dfFra.rename(columns={'Value':'Flow'}, inplace=True)
            # inplace=True does this function on the orginal dataframe

        # no time information so use dt.date
        dfFra['Date']=[dt.date(iyr,1,1)+dt.timedelta(days=idd-1) for iyr, idd in zip(dfFra['YEAR'],dfFra['DD'])]
        # taking the value from the yr column, jan1st date, and making jan1 column to be 1 not 0
        dfFra.head(2)

        # select portion of dataframe in desired date range
        dfFra2=dfFra.loc[(dfFra.Date>=startjan.date())&(dfFra.Date<=fraserend.date())]
        riv_time=dfFra2['Date'].values
        rivFlow=dfFra2['Flow'].values
        # could also write dfFra['Date'], sometimes this is required
        # newstart is a datetime object, so we convert it to just a date with .date
    else:
        dfFra=pd.read_csv('/data/dlatorne/SOG-projects/SOG-forcing/ECget/Fraser_flow',sep='\s+',
                  comment='#',names=('Year','Month','Day','Flow'))
        dfFra['Date']=[dt.datetime(int(y),int(m),int(d)) for ind,(y,m,d,f) in dfFra.iterrows()]
        dfFra2=dfFra.loc[(dfFra.Date>=startjan)&(dfFra.Date<=fraserend)]
        riv_time=dfFra2['Date'].values
        rivFlow=dfFra2['Flow'].values

    allvars=(no3_past250m,riv_time,rivFlow)
    pickle.dump(allvars,open(savepath2,'wb'))
else:
    pvars=pickle.load(open(savepath2,'rb'))
    (no3_past250m,riv_time,rivFlow)=pvars