Tidal current sensitivity
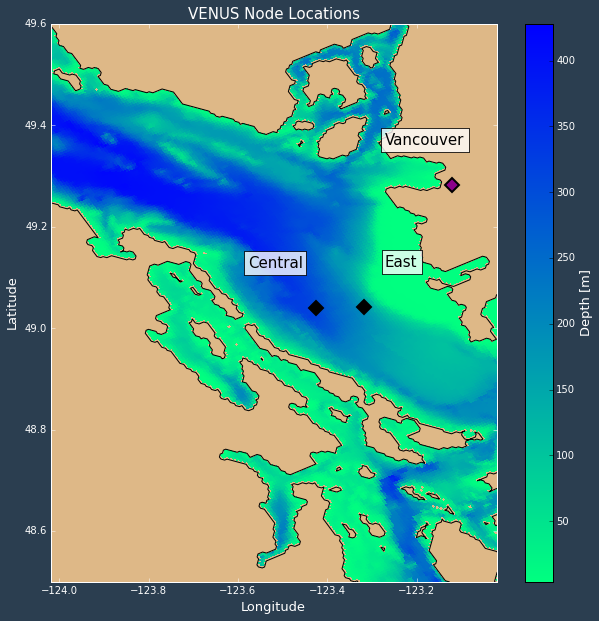
The Salish Sea MEOPAR model outputs daily averages and hourly averages of tracers and velocities at every grid point. It also outputs quarter-hourly results at the Ocean Networks Canada VENUS Central and East nodes. The image below indicates where the Central and East nodes are located.
We wonder if it is beneficial to compile the quarter-hourly data for the velocities and whether or not it would produce a more accurate tidal ellipse.
The quarter-hourly output has started on May 9th 2015, where as the hourly output has been produced with the current tidal configuration since November 26th 2014.
The separation of harmonic tidal constituents is important when we want to look at a single constituent’s effect on the current. This is accomplished with a long time series. Therefore, we want to see the effects of the length of a time series on the tidal ellipses.
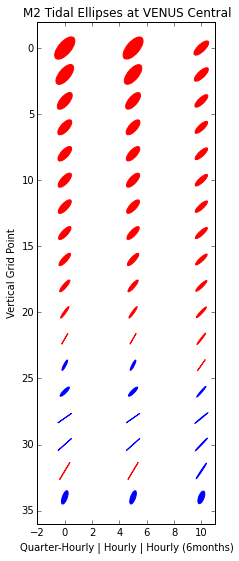
The figure below is a comparison of the depth profile of tidal ellipses for one month of quarter-hourly output, one month of hourly output and 6 months hourly output.
The table below is populated with the values that were used to create the figure above.
Table 1: Sensitivity to Frequency and Length Comparison
Central |
Quarter-Hourly |
Hourly |
Hourly (6months) |
||||||
|---|---|---|---|---|---|---|---|---|---|
Depth (m) |
Major-Axis (m/s) |
Minor-Axis (m/s) |
Inclination (deg. ccw E) |
Major-Axis (m/s) |
Minor-Axis (m/s) |
Inclination (deg. ccw E) |
Major-Axis (m/s) |
Minor-Axis (m/s) |
Inclination (deg. ccw E) |
0.5 |
0.29 |
-0.13 |
129 |
0.29 |
-0.13 |
129 |
0.20 |
-0.08 |
135 |
2.5 |
0.26 |
-0.12 |
129 |
0.26 |
-0.12 |
129 |
0.19 |
-0.07 |
135 |
4.5 |
0.22 |
-0.10 |
129 |
0.22 |
-0.09 |
129 |
0.18 |
-0.06 |
135 |
6.5 |
0.20 |
-0.09 |
130 |
0.20 |
-0.09 |
130 |
0.17 |
-0.06 |
136 |
8.5 |
0.20 |
-0.08 |
131 |
0.19 |
-0.08 |
131 |
0.17 |
-0.06 |
136 |
10.5 |
0.19 |
-0.08 |
131 |
0.19 |
-0.08 |
131 |
0.17 |
-0.05 |
136 |
12.5 |
0.19 |
-0.07 |
132 |
0.19 |
-0.07 |
132 |
0.17 |
-0.05 |
136 |
14.6 |
0.18 |
-0.06 |
132 |
0.18 |
-0.06 |
132 |
0.17 |
-0.04 |
136 |
16.8 |
0.17 |
-0.05 |
131 |
0.17 |
-0.05 |
131 |
0.16 |
-0.04 |
136 |
19.5 |
0.16 |
-0.04 |
129 |
0.16 |
-0.04 |
129 |
0.16 |
-0.03 |
135 |
24.1 |
0.15 |
-0.02 |
125 |
0.15 |
-0.02 |
125 |
0.16 |
-0.02 |
132 |
34.7 |
0.14 |
-0.00 |
119 |
0.13 |
-0.00 |
119 |
0.15 |
-0.01 |
127 |
58.5 |
0.12 |
0.02 |
116 |
0.12 |
0.02 |
116 |
0.15 |
-0.00 |
124 |
98.1 |
0.13 |
0.03 |
134 |
0.13 |
0.03 |
134 |
0.15 |
0.02 |
130 |
147.1 |
0.18 |
0.00 |
144 |
0.18 |
0.00 |
144 |
0.17 |
0.01 |
140 |
199.6 |
0.19 |
0.00 |
137 |
0.19 |
0.00 |
137 |
0.18 |
0.01 |
133 |
253.1 |
0.22 |
-0.00 |
120 |
0.22 |
-0.00 |
120 |
0.20 |
0.01 |
123 |
306.8 |
0.15 |
0.05 |
109 |
0.15 |
0.05 |
109 |
0.14 |
0.06 |
110 |
Frequency
One month of quarter-hourly values makes no significant difference on the tidal ellipse parameters at the ONC VENUS Central node. The changes are sparse and minimal.
We will need to wait until we have a longer quarter-hourly data set to see if it is beneficial for tidal ellipses, or try other more sensitive locations.
Length
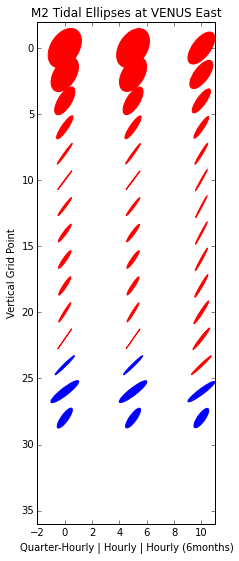
The 6 months time series has two significant differences that lead us to believe that these ellipses are a better representation of the currents:
The smaller surface currents indicates that it averages out some of the surface currents that are due to winds or Fraser River outflow.
The smoother variations throughout the water column. It is not logical for the flow to fluctuate every couple of meters throughout the water column.
A longer time series enables us to separate and resolve the individual harmonic constituents so that we can be certain that we are only looking at the M2 tidal constituent.
We observe the benefits of a longer time series at the ONC VENUS East node as well.
Seasons
Table 2: The effect of seasonality on tidal ellipse parameters
East |
Winter (Nov 26, 2014 - Feb 26, 2015) |
Spring (Feb 27, 2015 - May 27, 2015) |
||||
|---|---|---|---|---|---|---|
Depth (m) |
|
|
Inclination (deg. ccw E) |
|
|
Inclination (deg. ccw E) |
0.5 |
0.38 |
-0.14 |
127 |
0.40 |
-0.20 |
128 |
2.5 |
0.33 |
-0.11 |
127 |
0.35 |
-0.16 |
128 |
4.5 |
0.29 |
-0.06 |
125 |
0.30 |
-0.09 |
126 |
6.5 |
0.27 |
-0.04 |
122 |
0.26 |
-0.04 |
124 |
8.5 |
0.27 |
-0.03 |
118 |
0.24 |
-0.01 |
122 |
10.5 |
0.27 |
-0.03 |
115 |
0.24 |
0.01 |
119 |
12.5 |
0.28 |
-0.04 |
115 |
0.24 |
0.01 |
117 |
14.6 |
0.29 |
-0.04 |
116 |
0.25 |
0.00 |
116 |
16.8 |
0.30 |
-0.05 |
117 |
0.26 |
-0.01 |
117 |
19.5 |
0.31 |
-0.05 |
119 |
0.27 |
-0.02 |
119 |
24.1 |
0.32 |
-0.06 |
123 |
0.29 |
-0.03 |
122 |
34.7 |
0.31 |
-0.05 |
127 |
0.29 |
-0.03 |
127 |
58.5 |
0.31 |
-0.03 |
136 |
0.28 |
-0.02 |
134 |
98.1 |
0.35 |
-0.05 |
143 |
0.36 |
-0.07 |
142 |
147.1 |
0.25 |
0.09 |
124 |
0.25 |
0.08 |
125 |
Larger, more circular currents at the surface in the spring
Narrower and smaller currents at mid-depths in the spring
The deep bottom currents are almost identical.
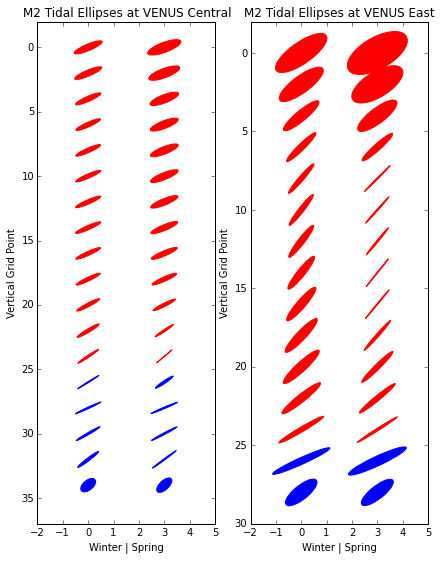
The Central node has a similar but muted difference between the seasons.
The bottom ~150m are mostly the same throughout winter and spring. We expect this because there isn’t much movement there.
The semi-major and semi-minor axis are larger throughout the upper part of the water column in the spring.